Surveying the St. Joseph: How local data could shape the river’s future
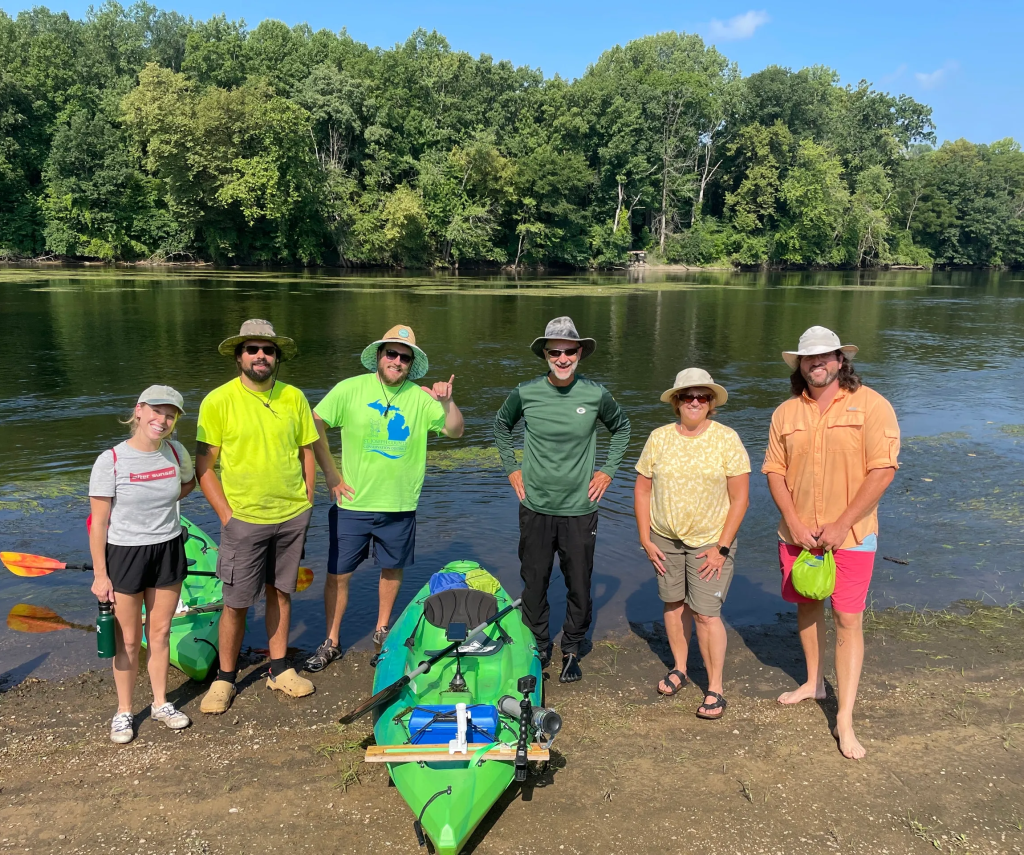
Since 2020, the district has been conducting a survey of the St. Joseph River, paddling mile by mile, collecting thousands of data points to help assemble an interactive map that will give a full-scale understanding of the river — from bird sightings to trash collected to water safety.
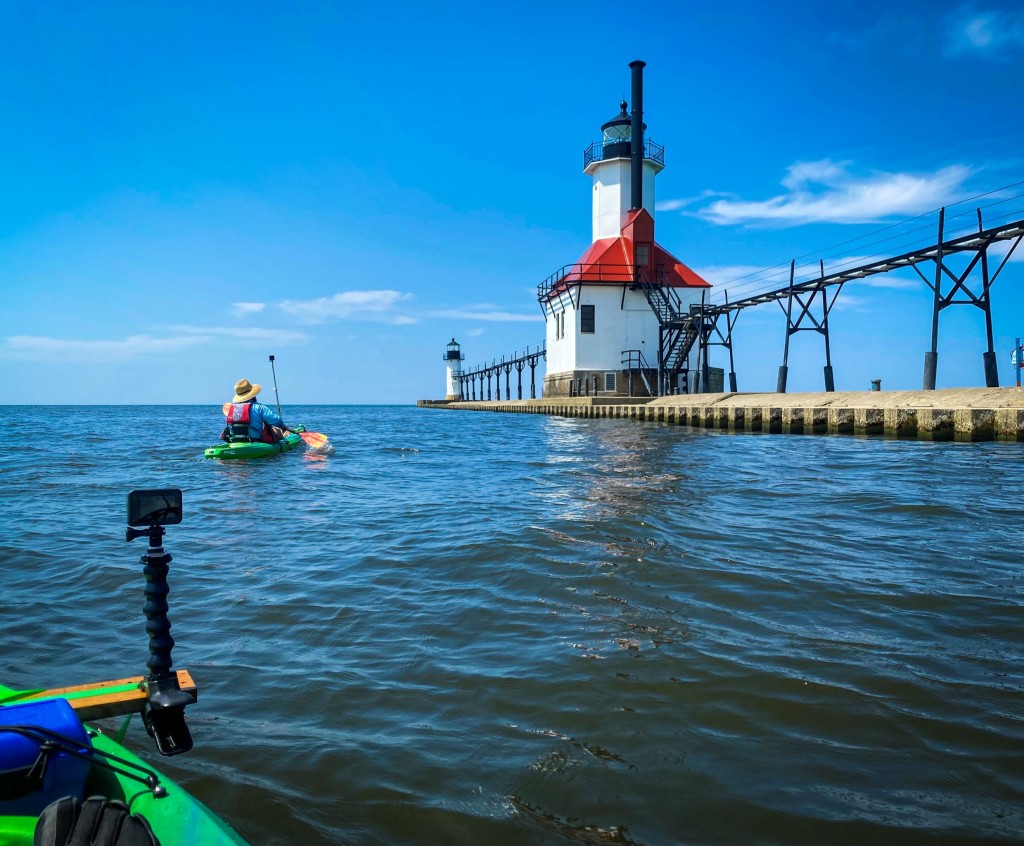
The St. Joseph River has long been a staple of life in the area. It’s what allowed Three Rivers first settlers to cultivate their crops, hunt for fish, and travel to other parts of the Great Lake state. The river, which stretches 206 miles from its headwaters to Lake Michigan, serves as a peaceful backdrop for most. For the St. Joseph County Conservation District, however, it’s a living system aching to be understood.
Since 2020, the district has been conducting a survey of the river, paddling mile by mile, collecting thousands of data points to help assemble an interactive map that will give a full-scale understanding of the river — from bird sightings to trash collected to water safety.
“Even if folks don’t paddle, fish, or set foot in the water, the rivers in their watershed still quietly shape their lives,” said District Conservation Specialist and project lead Kaitlin Renehan.
“They influence the water we drink, the food we grow, the protection we rely on during heavy rains, and the health of our communities,” she said.
Inception
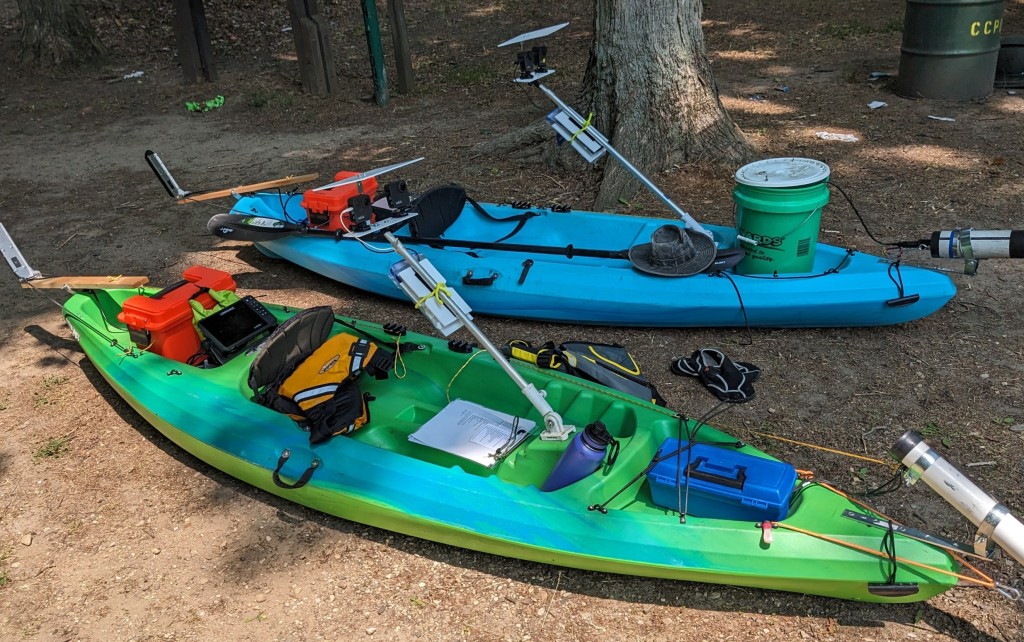
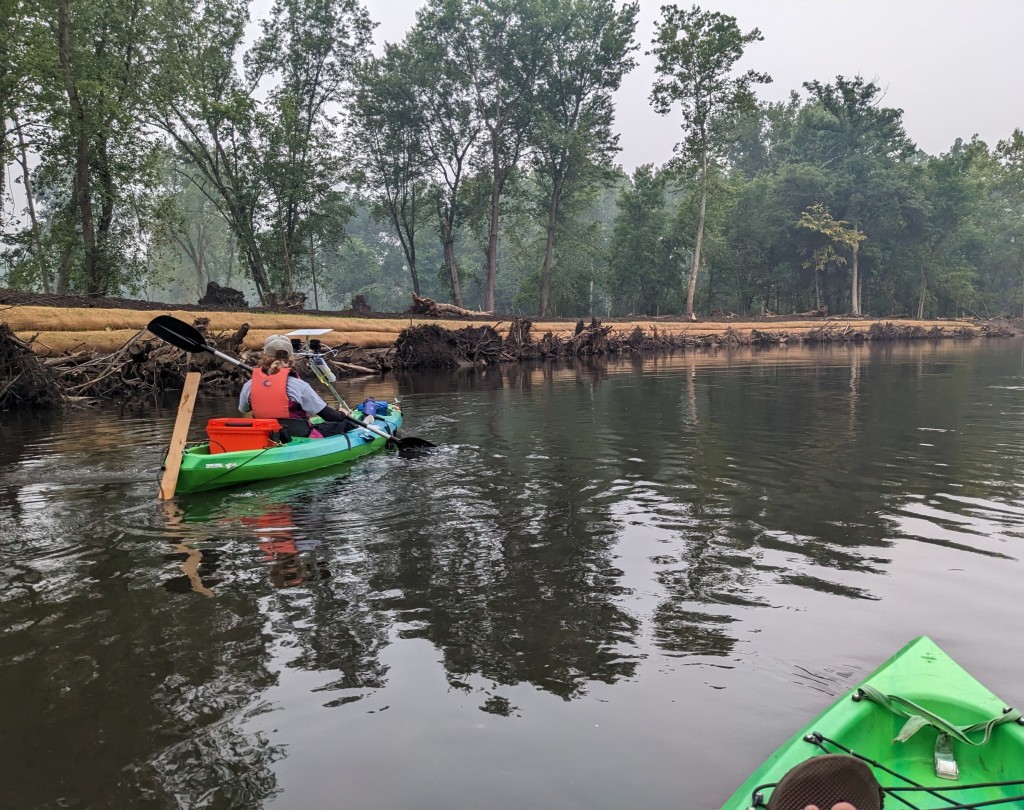
The project began with funding from the Great Lakes Restoration Initiative (GLRI), allowing Renehan and her team to launch a full survey of the river. Over 43 days in the field, trained technicians kayaked the entire 206-mile stretch, documenting riverbank erosion, invasive species, discharge pipes, algal growth, and more. Each observation was tagged with exact GPS coordinate, producing more than 6,000 data points, tens of thousands of water quality measurements, and full-scale 360-degree video.
Past studies of the river have focused on fixed sites or smaller locations. This effort was different in that it covered the entire river in a continuous, consistent way.
“Local assessments are still an important part of the picture, but this work helps fill in the gaps, connect the dots, and offer a clearer sense of how the river is doing as a whole.”
Renehan shared that some of the findings were troubling.
“We encountered a wide range of conditions from headwaters to river mouth. Many of the issues we saw — including erosion, habitat loss, and disrupted flow patterns — were linked to shoreline development practices that are incompatible with natural river processes. But there were also stretches of river that were distinctly resilient and full of life. We recorded native plants such as the state-threatened water-willow, flourishing freshwater and mussel beds, and stretches of clear water with diverse in-stream habitat and naturally buffered shorelines,” she said.
Stepping back
The mainstream survey wrapped in 2022, and a second round of GLRI funding followed, this time from the USDA Forest Service, with the hopes of expanding research into key tributaries including the Portage, Rocky, Dowagiac, and Paw Paw rivers.
The new phase came with high-tech upgrades including bathymetric sonar which is used to map riverbed contours, multi parameter water quality sensors, and 360-degree time lapse cameras. These tools will help provide as comprehensive a view of the river conditions as Renehan and her team could have hoped when they first took on the project.
“One of the most striking patterns is just how quickly conditions can shift over short distances,” Renehan said.
“Segments bordered by wetlands or forest corridors often feature improved water clarity and well-anchored steambanks. In contrast, reaches bordered by vertical retaining walls, turf grass to the edge, or channelized ditches frequently show erosion, sedimentation, and invasive growth.”
Real-world impact
The Conservation District’s findings are already making a tangible impact, helping prioritize erosion control projects, guide restoration funding, and shape conversations with local leaders about how infrastructure decisions influence water quality. The district’s water quality page offers a glimpse of the work so far, including an interactive Observations Map of more than 7,000 georeferenced data points and a virtual kayak tour of the St. Joseph River created with EarthViews, Inc. These tools allow users to see the river through the eyes of surveyors, spotting everything from invasive plants and eroding banks to stretches of healthy habitat.
In December 2025, the district will take public access a step further with the launch of a new interactive mapping tool. This platform will let residents, educators, and officials zoom in on exact points along the river to explore bird sightings, invasive species locations, erosion data, and water quality trends. It will build on existing resources by offering richer layers of multimedia and more filtering options, making complex environmental data easier to explore and understand.
“We hope the new mapping tools help people feel more connected to the St. Joseph River,” Renehan said. “For residents, it’s a chance to explore familiar places in a new way. For educators, it’s a way to bring local science into the classroom. For officials and planners, it’s a resource that can guide decisions.”
Day to day
The work is not without its challenges. A typical survey day starts early, staging vehicles at launch and takeout points before outfitting kayaks with cameras, sensors, sonar, and audio recorders. Each paddler takes one bank and records real-time observations keyed to their GPS’s. Weather can delay the work, while low bridges, downed trees, and dam structures can block access entirely.
But Renehan views the long days as a privilege.
“What stays with me the most is the time spent on the water–paddling mile by mile, immersed in a living system that connects so many of our communities. Being trusted to engage so closely with a river that shapes the identity of this region means a great deal to me,” Renehan said.
What’s next?
Once the mapping tool is launched in December, the District hopes to integrate tributary survey data, install interpretive signage at public access points, and look into ADA-compliant kayak launches. Once the mapping tool is launched, the District hopes to integrate tributary survey data, install interpretive signage at public access points, and even explore ADA-compliant kayak launches.
“Our goal is to make the river system more visible and understandable,” Renehan said. “When we recognize the river as more than just scenery — as something with a shared history and future — we’re more likely to protect it.”
In the meantime, the District invites residents to join the work firsthand — whether by planting native species, joining a cleanup, or learning more about the river. Their next cleanup is Wednesday, August 20 on the Fawn River, and all are welcome.
“Every action matters,” Renehan said. “The more people see and understand the watershed, the more empowered we become to protect it — not out of obligation, but because stewardship grows naturally from connection to the places we know and care about.”
Maxwell Knauer is a staff writer for Watershed Voice.
Author

Related Articles
Local stories hit the big screen at Kalamazoo Film Society’s fourth annual showcase
The event features mostly filmmakers from Kalamazoo and the surrounding region, with films shot in — and in some cases about — the city itself.
One of the featured filmmakers, Jerod Kauffman, created a documentary about the final days of the longtime dive bar Harvey’s on the Mall, which closed after a buyout. Kauffman said he wanted to capture the story of a place that helped define Kalamazoo’s nightlife culture.
“The closure was sudden to everyone — the community and staff — so I wanted to immortalize a place that was loved by so many,” Kauffman wrote to Watershed Voice. “I saw a fence and bulldozer outside the building today on the way to work. I think it’s going to be torn down, so I am happy I was able to capture a piece of Kalamazoo history and the bar that stood and served the community for 40+ years.”
Useless Creatures to donate all of today’s sales to tornado relief
Useless Creatures Brewing Company plans to donate all sales today, Thursday, March 12 to tornado recovery efforts. All of the money will go to The Huss Project who has been organizing volunteers, collecting donations, and providing resources for those in need in the wake of the tornado.
Sturgis Civic Players to present “Anne of Green Gables” March 20–22 at Sturges-Young Center for the Arts
Directed by Elizabeth Smith of Sturgis and adapted from one of the best-selling books in the world, Anne of Green Gables follows Anne Shirley’s journey from a mischievous girl to a young woman, exploring themes of imagination, belonging, and family.
This production spans six years of Anne’s life — from her arrival in Avonlea as a 12-year-old to her young adulthood at 18 as she prepares to set out on her own. The production highlights many of the story’s most beloved moments.
